

Despite the fact that the years 2012 and 2013 have brought significant prosperity to the housing market, homeowners must still be strategic and realistic when pricing their homes for sale. As shown by the various info-graphics below, it is still likely that the real estate industry has a measure of recovering to do before home sellers can wield the type of negotiating power they once did during the housing boom almost a decade ago. Accordingly, daring sellers that overprice their homes are rolling the dice that current housing trends don't continue into 2014.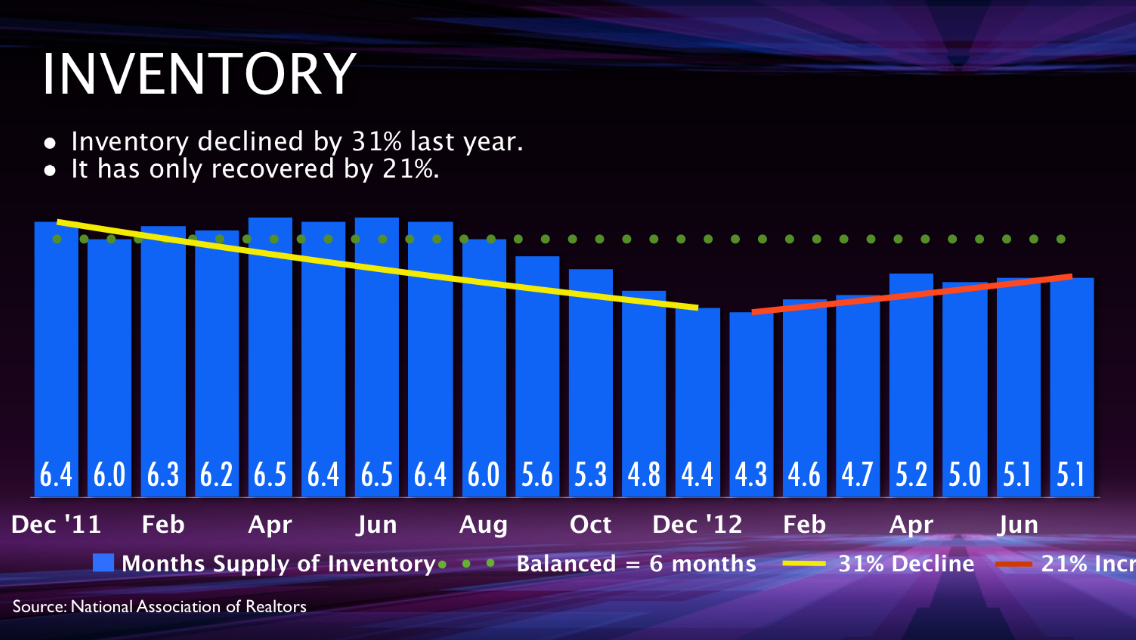
INVENTORY
After a 31% year-over-year decline from December 2011 to December 2012, housing inventory has steadily recovered by 21% year-to-date in 2013. The horizontal dotted green line in the graphic above represents 6 months of housing inventory, which the real estate industry generally considers the shifting point between a buyer's and seller's market. Although 2012 quickly transitioned into a strong seller's market, more new home starts, rising interests rates and increasing home prices have brought housing supply much closer in line with demand in 2013.

INVENTORY BY PRICE POINT
The selection of homes available to purchase can vary dramatically depending upon the price. The white and blue lines in the chart above illustrate that there are still far more entry level and move-up buyers than there are homes for them to buy. Yet there is once again a large selection of luxury homes to chose between with almost 8 months of inventory currently back on the market for sale.

AFFORDABILITY INDEX
The National Association of Realtors' (NAR) Housing Affordability Index shows the general affordability of housing to the public at a particular point in time. The Housing Affordability Index takes into account the national median home price, the median family income and the average mortgage interest rate. After the Housing Affordability Index hit record highs in 2012, it corrected by declining 35% year-to-date in 2013. The recent surge in home prices and sales, along with rising interest rates, have contributed to this development.


MORTGAGE RATES
The graph above illustrates the historic average interest rate for 30 year fixed rate mortgages according to Freddie Mac data. An average interest rate of 8.68% over the past 40 years truly puts our current mortgage interest rates into proper perspective. If interest rates continue to rise as expected by most economic experts, buyer demand will definitely be diminished.

BUILDER CONFIDENCE
For the first time since the housing boom in 2005, new home builders are once again showing confidence and are starting new residential projects at an increased rate. In fact, new home starts will likely be the most formidable competition for resale home sellers in the years to come. For the past several years many new home builders have been waiting idly on the sidelines to build until home prices rose to a level at which they could sell for a profit again. This absence of new home inventory has helped keep housing supply artificially low in the face of increasing buyer demand. Look for this trend to continue to change over the next several years.
So despite the robust recovery exhibited by the real estate market in recent years, it is clear that housing supply is now steadily catching back up with buyer demand. Such an equilibrium would yield a more level playing field between home sellers and buyers. It is thereby advisable for home sellers to price their homes to sell expediently in advance of this trend of competing home sellers entering the market.
MORE FROM BRIAN ICENHOWER
& THE REAL ESTATE WORD
